Are you looking for a complete guide on Linear Discriminant Analysis Python?. If yes, then you are in the right place. Here I will discuss all details related to Linear Discriminant Analysis, and how to implement Linear Discriminant Analysis in Python. So, give your few minutes to this article in order to get all the details regarding the Linear Discriminant Analysis Python.
Hello, & Welcome!
In this blog, I am gonna tell you-
Linear Discriminant Analysis Python
Linear Discriminant Analysis is used for dimensionality reduction. Now you may be thinking, “What is Dimensionality Reduction?”. So before moving into Linear Discriminant Analysis, first understand about Dimensionality Reduction.
What is Dimensionality Reduction?
Dimensionality Reduction is a pre-processing step used in pattern classification and machine learning applications.
Let me simplify it,
The data you collect for processing is big in size. So to process huge size data is complex. It requires more processing power and space. Therefore Dimensionality Reduction comes into the scene. It reduces the dimension of data.
So, What you mean by Reducing the dimensions?
Suppose, This is our dataset scattered on 2 dimensional space.
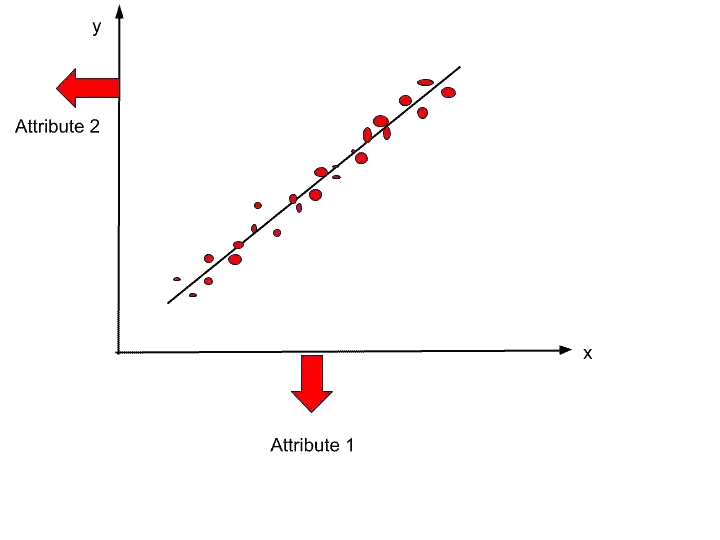
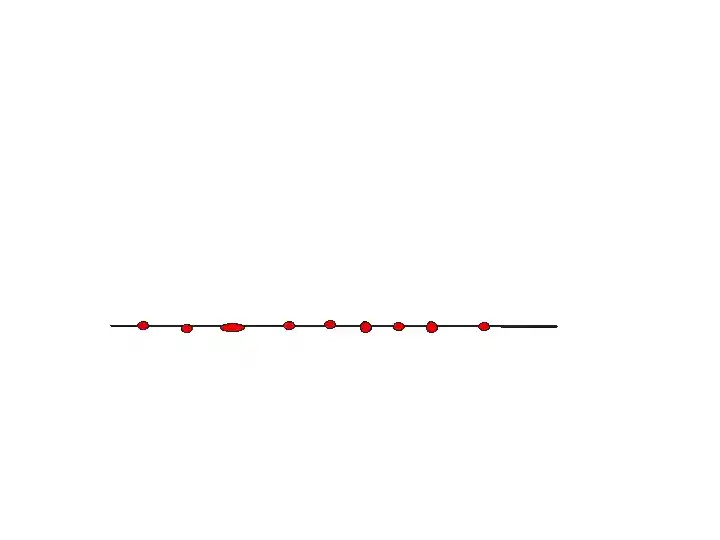
So, we can represent these data items in 1-dimensional space by applying dimensionality reduction. After applying dimensionality reduction data points will look something like that-

So, Dimensionality Reduction is a technique to reduce the number of dimensions. In this example, we reduced from 2- dimension to 1-dimension. I hope now you understood dimensionality reduction.
The principal component analysis is also one of the methods of Dimensionality reduction. I have already written an article on PCA. You can read this article here- What is Principal Component Analysis in Machine Learning? Complete Guide!
Now, let’s move into Linear Discriminant Analysis-
What is a Linear Discriminant Analysis?
Linear Discriminant Analysis is a method of Dimensionality Reduction. The goal of LDA is to project a dataset onto a lower-dimensional space. It sounds similar to PCA. Right?
But LDA is different from PCA. Linear Discriminant Analysis finds the area that maximizes the separation between multiple classes. That is not done in PCA.
So, the definition of LDA is- LDA project a feature space (N-dimensional data) onto a smaller subspace k( k<= n-1) while maintaining the class discrimination information.
PCA is known as Unsupervised but LDA is supervised because of the relation to the dependent variable.
Now, let’s see how LDA works-
How Linear Discriminant Analysis Works?
LDA works in following steps-
Step 1-
Compute the d-dimensional mean vectors for the different classes from the dataset.
Step 2-
Compute within class Scatter matrix (Sw).
Suppose we have a 2-D dataset C1 and C2. So to calculate Sw for 2-D dataset, the formula of Sw is-
Sw = S1+ S2
S1 is the covariance matrix for the class C1 and S2 is the covariance matrix for the class for C2.
Now, the formula of covariance matrix S1 is-
S1= Σ (x-u1).(x-u1)^T
Where u1 is the mean of class C1. Similarly, you can calculate S2 and C2.
Step 3-
Compute between class Scatter Matrix (Sb)
The formula for calculating Sb is-
Sb= (u1-u2).(u1-u2)^T
Step 4-
Compute the eigenvectors (e1,e2, e3,……ed) and corresponding eigenvalues ( λ1, λ2,,…… λd) for the scatter matrix.
Step 5–
Sort the eigenvectors by decreasing eigenvalues and choose k eigenvectors with the largest eigenvalues to form a d X k dimensional matrix W.
Step 6-
Reduce the Dimension
y= W^T. X
Where W^T is projection vector and X is input data sample. Here, projection vector corresponds to highest Eigen value.
So, let’s visualize the whole working of LDA-
Suppose, this black line is the highest eigenvector, and red and green dots are two different classes.
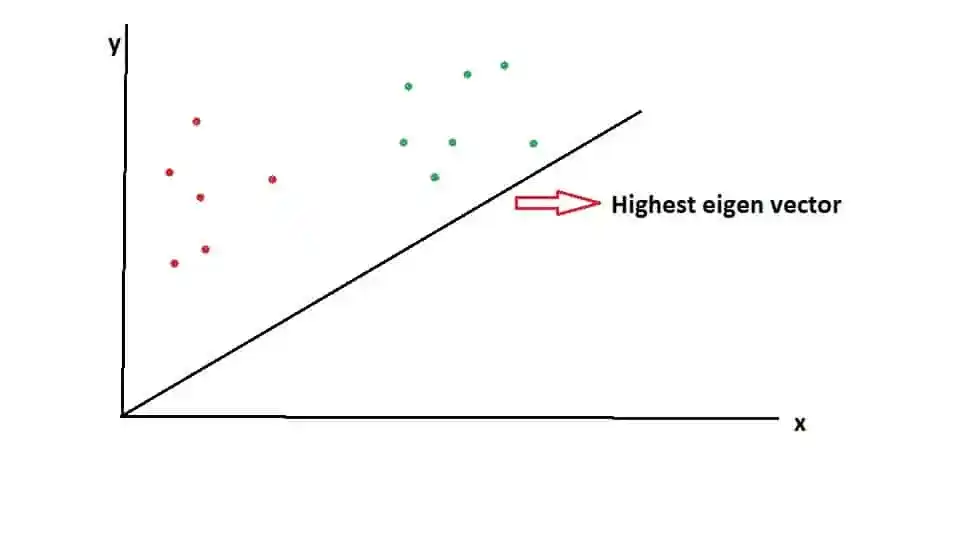
When data points are projected onto this vector, so the dimensionality is reduced as well as the discrimination between the classes is also visualized.
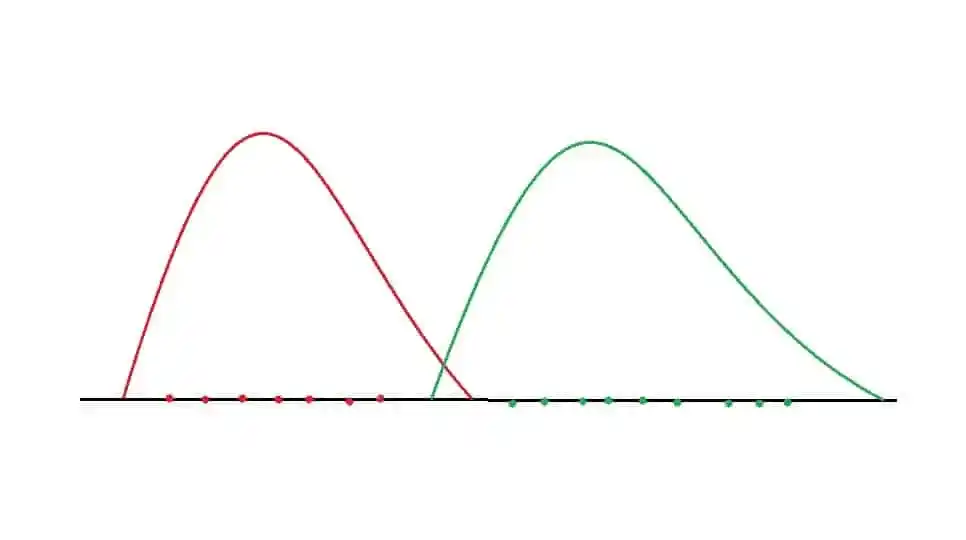
In that image, Red represents one class and green represents second class. So, by applying LDA, the dimension is reduced as well as the separation between two classes are also maximized.
I hope, now you understood the whole working of LDA. Now, let’s see how to implement Linear Discriminant Analysis in Python.
Implementation of Linear Discriminant Analysis in Python
For this implementation, I am going to use Wine Dataset. You can download the dataset from here.
Our objective is to identify different customer segments based on several wine features available. So, the shop owner of Wine shop can recommend wine according to the customer segment.
Now, let’s start with the first step-
1- Import important libraries
import numpy as np
import matplotlib.pyplot as plt
import pandas as pd
2- Load the Dataset
dataset = pd.read_csv('Wine.csv')
X = dataset.iloc[:, 0:13].values
y = dataset.iloc[:, 13].values
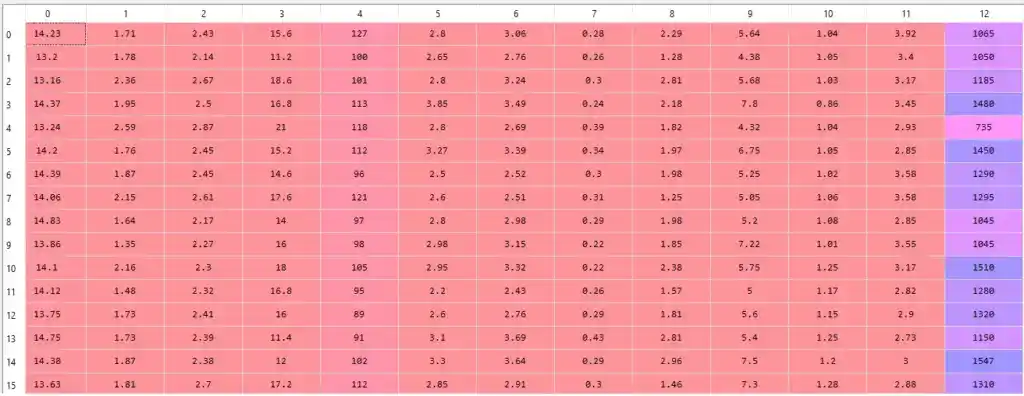
After splitting the dataset into X and Y, we will get something like that-
Here X is independent variables and Y is dependent variable. Y is dependent because the prediction of y depends upon X values.
X-
Y-
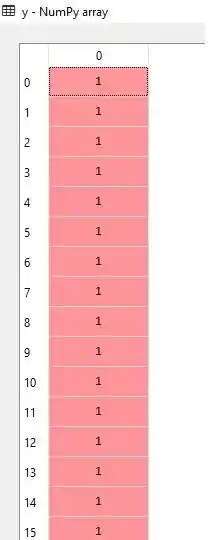
Now, the next step is-
3- Split the dataset into the Training set and Test set
from sklearn.model_selection import train_test_split
X_train, X_test, y_train, y_test = train_test_split(X, y, test_size = 0.2, random_state = 0)
Here, we are dividing the dataset into Training set and Test set. That means, we use maximum data to train the model, and separate some data for testing.
4- Apply Feature Scaling
from sklearn.preprocessing import StandardScaler
sc = StandardScaler()
X_train = sc.fit_transform(X_train)
X_test = sc.transform(X_test)
Feature scaling is an important step to perform. After applying feature scaling, we will get our data in this form-
X train-
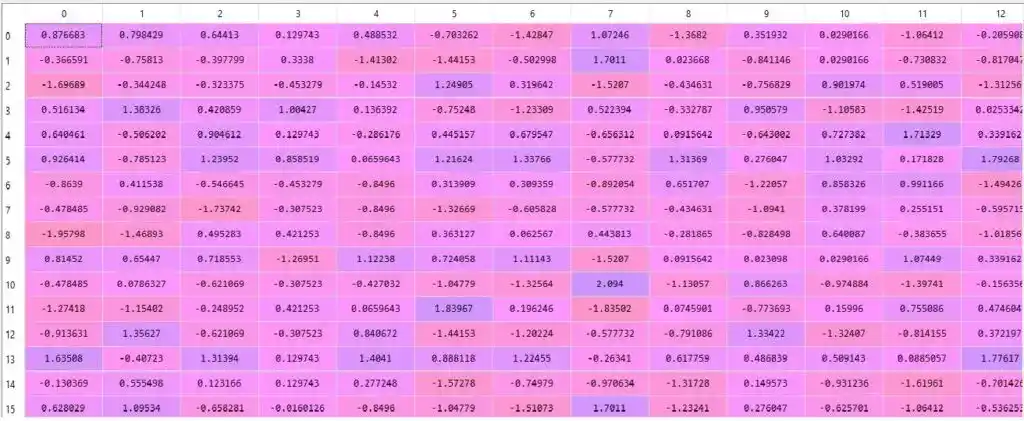
Here the values are scaled. After applying feature scaling, it’s time to apply Linear Discriminant Analysis (LDA).
5. Apply LDA
from sklearn.discriminant_analysis import LinearDiscriminantAnalysis as LDA
lda = LDA(n_components = 2)
X_train = lda.fit_transform(X_train, y_train)
X_test = lda.transform(X_test)
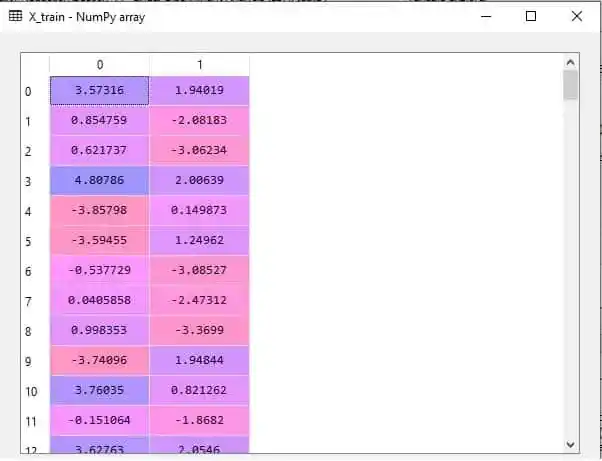
Here, n_components = 2 represents the number of extracted features. That means we are using only 2 features from all the features. And these two features will give best result.
So, after applying LDA, we will get X_train and X_test something like that-
X_train-
X_ Test-
After applying LDA, now it’s time to apply any Classification algorithm. Here I am using Logistic Regression. But you can use any other classification algorithm and check the accuracy.
6. Fit Logistic Regression to the Training set
from sklearn.linear_model import LogisticRegression
classifier = LogisticRegression(random_state = 0)
classifier.fit(X_train, y_train)
NOTE- Always apply LDA first before applying classification algorithm.
Now, it’s time to predict the result.
7. Predict the Test set results
y_pred = classifier.predict(X_test)After running this code, we will get Y_Pred something like that-
8. Check the accuracy by Confusion Matrix
from sklearn.metrics import confusion_matrix, accuracy_score
cm = confusion_matrix(y_test, y_pred)
print(cm)
accuracy_score(y_test,y_pred)
We got this confusion matrix and accuracy score, that is superb! We got 100% accuracy.
[14 0 0]
[ 0 16 0]
[ 0 0 6]
Out: 1.0
Now, let’s visualize the Test set result-
9. Visualize the Test set results
from matplotlib.colors import ListedColormap
X_set, y_set = X_test, y_test

X1, X2 = np.meshgrid(np.arange(start = X_set[:, 0].min() - 1, stop = X_set[:, 0].max() + 1, step = 0.01), np.arange(start = X_set[:, 1].min() - 1, stop = X_set[:, 1].max() + 1, step = 0.01))

plt.contourf(X1,X2,classifier.predict(np.array([X1.ravel(),X2.ravel()]).T).reshape(X1.shape), alpha = 0.75, cmap = ListedColormap(('red', 'green', 'blue')))

plt.xlim(X1.min(), X1.max())
plt.ylim(X2.min(), X2.max())

for i, j in enumerate(np.unique(y_set)):
    plt.scatter(X_set[y_set == j, 0], X_set[y_set == j, 1],
                c = ListedColormap(('red', 'green', 'blue'))(i), label = j)

plt.title('Logistic Regression (Test set)')
plt.xlabel('LD1')
plt.ylabel('LD2')
plt.legend()
plt.show()
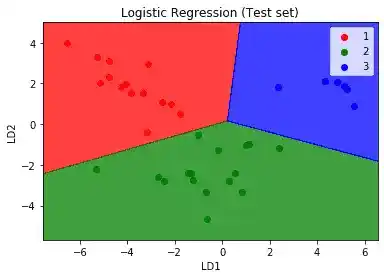
So, after running this code, we will get

Here, you can see all the three classes are falling into the correct region. There is no incorrect result.
I hope, you understood the whole work procedure of LDA. Now, it’s time to wrap up.
Conclusion
In this article, you learned everything related to the Linear Discriminant Analysis Python.
Specifically, you learned-
- What is the Dimensionality Reduction, Linear Discriminant Analysis?
- How linear Discriminant Analysis Work?
- And How to implement Linear Discriminant Analysis in Python.
I tried to make this article simple and easy for you. But still, if you have any doubt, feel free to ask me in the comment section. I will do my best to clear your doubt.
All the Best!
Happy Learning!
FAQ
Learn the Basics of Machine Learning Here
Looking for best Machine Learning Courses? Read this article- Best Online Courses On Machine Learning You Must Know in 2026
Read K-Means Clustering here-K Means Clustering Algorithm: Complete Guide in Simple Words
Are you ML Beginner and confused, from where to start ML, then read my BLOG – How do I learn Machine Learning?
If you are looking for Machine Learning Algorithms, then read my Blog – Top 5 Machine Learning Algorithm.
If you are wondering about Machine Learning, read this Blog- What is Machine Learning?
Thank YOU!
Though of the Day…
‘ Anyone who stops learning is old, whether at twenty or eighty. Anyone who keeps learning stays young.
– Henry Ford
Written By Aqsa Zafar
Aqsa Zafar is a Ph.D. scholar in Machine Learning at Dayananda Sagar University, specializing in Natural Language Processing and Deep Learning. She has published research in AI applications for mental health and actively shares insights on data science, machine learning, and generative AI through MLTUT. With a strong background in computer science (B.Tech and M.Tech), Aqsa combines academic expertise with practical experience to help learners and professionals understand and apply AI in real-world scenarios.

